In the dynamic realm of the stock market, indicators serve as crucial tools for traders and analysts to navigate complex financial landscapes. Broadly classified into two types, these indicators offer distinct insights. Trend indicators, such as moving averages, illuminate the prevailing market direction, aiding in the identification of upward or downward trends. Oscillators, including the Relative Strength Index (RSI) and Stochastic Oscillator, measure momentum, signaling potential overbought or oversold conditions. By employing a combination of trends and oscillators, market participants gain a comprehensive understanding of price movements, empowering them to make informed decisions and formulate effective trading strategies.
Types of Indicator in Stock Market
In the stock market, indicators are tools used by traders and analysts to gain insights into market trends, momentum, and potential reversals. There are two main types of indicators.
| Trend Indicators | Oscillators | |
| Purpose | Identify the direction of the prevailing trend. | Measure momentum and identify overbought or oversold conditions. |
| Examples | Moving Averages, Trendlines, Average Directional Index (ADX). | Relative Strength Index (RSI), Stochastic Oscillator, Moving Average Convergence Divergence (MACD). |
| Usage | Helpful in determining whether the market is in an uptrend, downtrend, or moving sideways. | Signal potential reversal points and assess the strength of price movements. |
Traders often use a combination of these indicators to make informed decisions and develop effective trading strategies based on market conditions.
Which Indicator Is Best for Intraday?
The choice of the best indicator for intraday trading depends on individual preferences, trading style, and market conditions. Different indicators serve various purposes in intraday analysis. Here are a few commonly used indicators for intraday trading.
| Stochastic Oscillator | Relative Strength Index (RSI) |
| Moving Averages | Volume Weighted Average Price (VWAP) |
1). Moving Averages- Simple Moving Averages (SMA) or Exponential Moving Averages (EMA) can help identify trends and potential reversal points in intraday charts.
2). Relative Strength Index (RSI)- RSI is an oscillator that measures the speed and change of price movements, indicating overbought or oversold conditions.
3). Stochastic Oscillator- This oscillator helps identify potential reversal points and assesses the closing price relative to its price range over a specified period.
4). Bollinger Bands- Bollinger Bands show volatility and potential price reversal points, helping traders identify overbought or oversold conditions.
5). Volume Weighted Average Price (VWAP)- VWAP is a technical indicator that reflects the average price a security has traded at throughout the day, helping traders gauge the intraday trend.
The effectiveness of an indicator depends on how well it aligns with a trader’s strategy and market conditions. It’s common for intraday traders to use a combination of indicators to get a comprehensive view of the market and make well-informed decisions. Traders often experiment with different indicators to find the ones that best suit their intraday trading approach.
Which Indicator Has Highest Accuracy?
It’s essential to note that no single indicator guarantees high accuracy in predicting market movements, as market conditions are dynamic and subject to change. The effectiveness of an indicator depends on the specific trading strategy, timeframe, and market conditions.
Traders often use a combination of indicators to confirm signals and reduce false signals. Additionally, factors such as risk management, market research, and staying informed about economic events play a crucial role in successful trading.
Some popular indicators, like Moving Averages, Relative Strength Index (RSI), and Moving Average Convergence Divergence (MACD), are widely used, but their accuracy depends on the context in which they are applied. Traders may need to adjust and fine-tune indicators based on their experience and the specific market they are trading.
Which Is the Biggest Stock Indicator?
There isn’t a single “biggest” stock indicator universally recognized as superior. Different indicators serve distinct purposes, and traders often use a combination for comprehensive analysis. Some widely followed indicators include:
a). Moving Averages (MA)- Used to identify trends and potential reversal points.
b). Relative Strength Index (RSI)- Measures momentum, indicating overbought or oversold conditions.
c). Moving Average Convergence Divergence- Helps identify trend direction & potential trend reversals.
d). Bollinger Bands- Gauge volatility and identify overbought or oversold conditions.
e). Volume- Indicates the strength of price movements.
The choice of the “biggest” indicator depends on a trader’s strategy, timeframe, and market conditions. Successful traders often use a combination of indicators for more accurate analysis.
What Is Smart Indicator?
In the stock market, “smart indicator” isn’t a single, universally defined term. Instead, it can refer to various indicators or trading strategies that aim to identify profitable opportunities by analyzing multiple data points and market behaviors. Here are some examples of popular “smart indicators” in the stock market.
- Smart Money Flow Index (SMI)- This indicator compares intraday buying and selling volume patterns to gauge potential shifts in investor sentiment.
- Volume Profile- This indicator visualizes the distribution of trading volume at different price levels, highlighting areas of potential support and resistance.
- Footprint Chart- This type of chart displays the volume and order flow behind each candlestick, providing insights into buying and selling pressure behind price movements.
What Is Indirect Indicator?
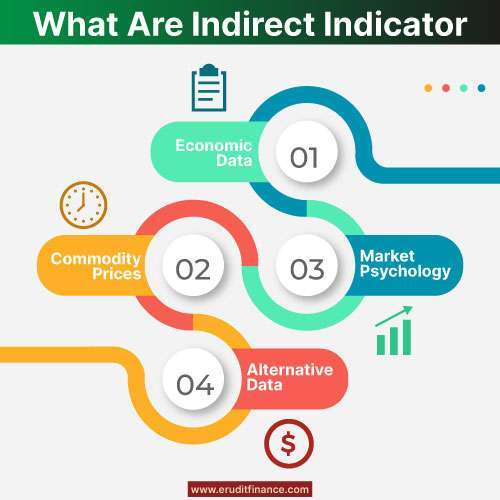
In the stock market, an indirect indicator, also known as a proxy indicator, can be any piece of information that doesn’t directly provide information about a specific company or the overall market but can still offer valuable insights by having a known relationship with it. Here are some examples of indirect indicators in the stock market:
Economic Data
- GDP Growth– Strong GDP growth often indicates higher corporate profits and consumer spending, potentially leading to rising stock prices.
- Inflation– Rising inflation can erode corporate profits and increase borrowing costs, putting pressure on stock prices.
- Interest Rates- Higher interest rates can make equities less attractive compared to fixed-income investments, potentially leading to market declines.
- Unemployment Rate– Lower unemployment can indicate stronger consumer demand and potentially higher profits for companies, leading to positive sentiment.
Commodity Prices
- Oil Prices– Fluctuations in oil prices can impact various sectors, like transportation and energy, and can also influence overall investor sentiment.
- Metals Prices- Metal prices can signal the outlook for various industries, such as construction and manufacturing, and can also act as a gauge for global economic activity.
Market Psychology
- Investor Sentiment Surveys- These surveys can provide insights into how investors are feeling about the market, with bullish sentiment potentially leading to buying and bearish sentiment potentially leading to selling.
- Technical Indicators- While not direct measurements of company performance, technical indicators can analyze various price and volume data points to potentially signal potential entry or exit points in the market.
Alternative data
- Satellite Imagery- Tracking changes in industrial activity through satellite images can offer insights into economic health and potentially predict business performance.
- Web Traffic Data- Analyzing web traffic to company websites or e-commerce platforms can provide hints about consumer interest and potentially predict future sales figures.
- Social Media Sentiment- Monitoring the tone and volume of discussions about specific companies or industries on social media can offer insights into public perception and potential future trends.
By understanding and using indirect indicators effectively, investors can gain valuable insights into market trends and potentially make more informed investment decisions.
Bottomline:-
In the dynamic realm of the stock market, indicators play a vital role. From trend indicators spotlighting market direction to oscillators measuring momentum, these tools empower traders with insights. Combining trends and oscillators, traders gain a comprehensive view, navigating market complexities and formulating effective strategies. Understanding the diverse types of indicators is key to informed decision-making, enhancing one’s ability to decipher market dynamics and make sound investment choices.
Also Read:-